 Continue - Leave debugging and keep running the program
It is really difficult to look at a few lines of code and know what will happen. The good news is, we don't have to guess! XCode comes with a built in visual debugger that will let us watch the execution of our programs step by step.
Start with the program you wrote for the format strings example that
print out variables of several types. On the left side of the editor
pane, you will see an empty grey column. Click in this column at the
first line of code within the @autorelease block. You
should see a dark blue arrow appear.
Try running the program again, this time, instead of running to completion, execution will halt at the blue arrow. At this point you can use the step controls to continue exeucting the program line by line. Note that the bottom left of the display now shows
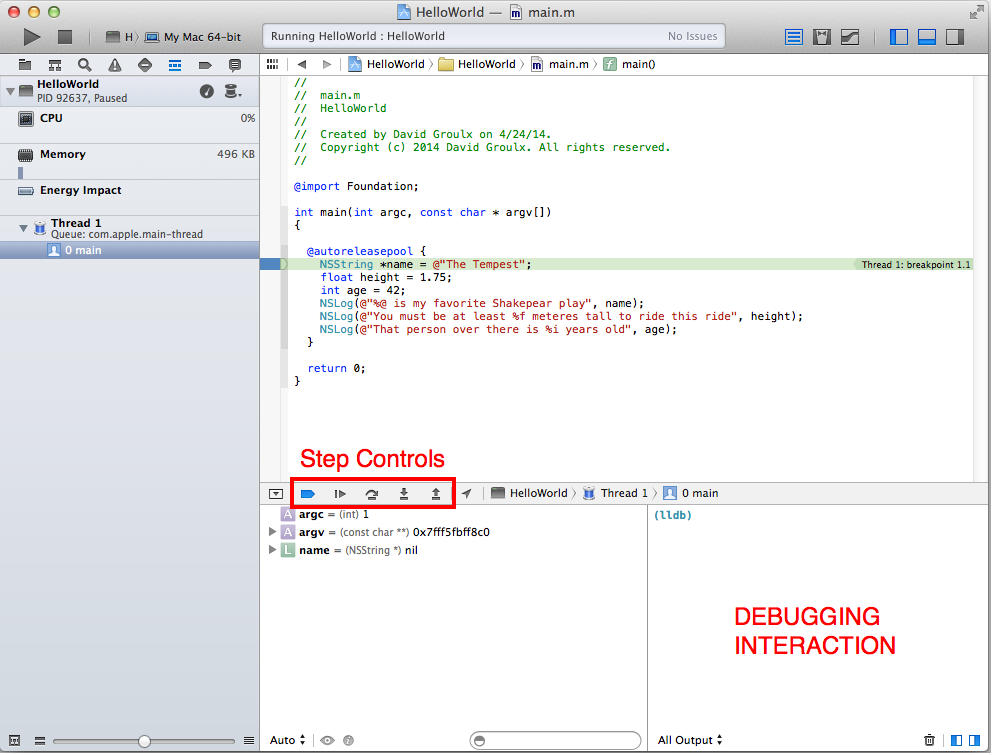
Continue - Leave debugging and keep running the program
 Step Over - Execute the current function and move to the next line
 Step Into - Step through the current function
 Step Out Of - Return back to the calling function